A newly updated version of SunSPOT has been launched to help consumers and businesses calculate the solar power potential of their rooftops.
The online application, developed by the Australian PV Institute (APVI) and UNSW Sydney, had previously been available only in a small number of locations in New South Wales.
With support from the Australian Government, it now works for locations across the country and comes with significant upgrades, more accurate estimates, a new user-friendly interface, and a version that is freely available without a council subscription.
Read more: Solar panels aren't perfect yet – we can make them even better and cheaper
“Finding out how much you can save with a battery, or what size solar system can fit on your roof, or getting estimates on the best system size for your electricity usage has never been simpler or safer,” says Dr Anna Bruce, SunSPOT Project Leader and Associate Professor of Renewable Energy Engineering at UNSW.
“SunSPOT V3 has been built by engineers at UNSW’s world leading School of Photovoltaic and Renewable Energy Engineering specifically to help people understand what solar can do for them – not to sell solar.
“It’s the only independent tool with this level of analysis available to the public in Australia. All other solar calculators seek to capture personal information and generate sales leads.
“Now, with nationwide delivery and improvements to its usability and accuracy, SunSPOT will be able to help the vast majority of Australians confidently navigate the complex solar market.”
Answering questions about solar and batteries
Previous versions of APVI’s flagship tool have only been available in areas where there is spatial mapping LiDAR data available and the local council has taken up a subscription. Now, with the support of the Australian Government, a ‘standard’ version of the tool that does not require LiDAR data has been released and can be used for free, everywhere.

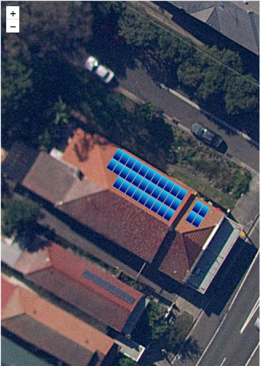
The SunSPOT tool helps users visualise where solar panels can be placed and how many might be possible, so they can run a cost-benefit analysis via the system. Photograph from APVI
Dr Mike Roberts, SunSPOT Project Leader and Senior Research Associate in the School for Photovoltaic and Renewable Energy Engineering at UNSW says: “Householders no longer need to depend on salespeople to educate them. With this latest version of SunSPOT, everyone can get reliable, tailored answers to common questions about solar and batteries.”
In two minutes, SunSPOT users can find out what system size will give them the best return on their investment and get an estimate of the cost and annual savings.
They can also compare the costs and annual savings with different battery sizes, answering the question in everyone’s heads: “Should I get a battery?”
Dr Roberts says: “The APVI has found that Australia has the potential to install 179 GW of rooftop solar capacity – but so far we’ve installed less than 10 per cent of that.
“179 GW of solar would generate more electricity annually than the total current annual electricity consumption in the national electricity market.
“Rooftop solar has a leading part to play in reducing Australia’s emissions.”
SunSPOT’s clever mapping tool allows users to drag and drop scaled groups of panels onto their roof so they can see how many panels will fit and where they can go.
Identifying best location for panels
There are two versions of SunSPOT available: the premium version that involves mapping the area with LiDAR data and is paid for through a subscription by the local council, and the standard version that is available to everyone, everywhere without the council subscribing.
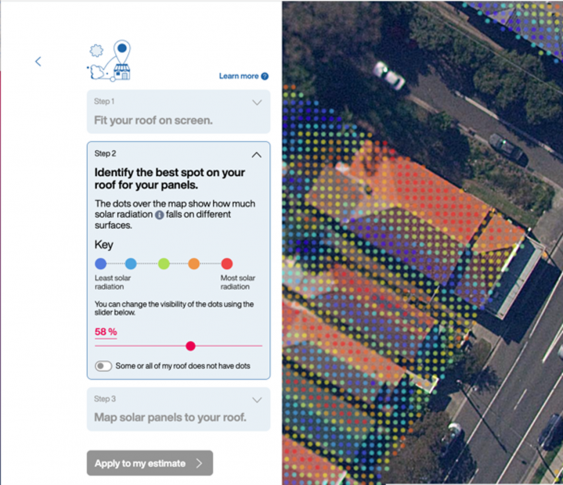
The premium subscription-based version of SunSPOT identifies the best areas for solar panels with red dots on the rooftops.

A premium version of SunSPOT shows users the best areas that solar panels could be placed, using red dots as an indicator. Photograph from APVI
Spatial mapping LiDAR data enables it to read the shape, slope and orientation of the rooftop. It can also estimate the amount of shading across the year on every 0.25m2 area on the roof, and the impact this has on bill savings. This is combined with Bureau of Meteorology weather data for the local area.
Users of both versions can add their smart meter data and electricity tariffs for even more accurate estimates.


