The ocean around New Zealand is getting warmer, and extreme warming events have become more frequent over the past years.
These marine heatwaves can have devastating impacts on ocean ecosystems. When they happen in summer, they usually receive a lot of attention. But those happening during winter, when the ocean is cooler, are often ignored.
Yet, these winter events can affect the spawning and recruitment of fish and other sea animals, and in turn have significant impacts on aquaculture and fisheries.
To monitor the occurrence of such extreme events around New Zealand, we developed a marine heatwave forecast tool, opens in a new window as part of the Moana Project, opens in a new window. The tool has been operational since January 2021 and it forecasts marine heatwave occurrence, intensity and duration for 13 areas defined in collaboration with the seafood industry.
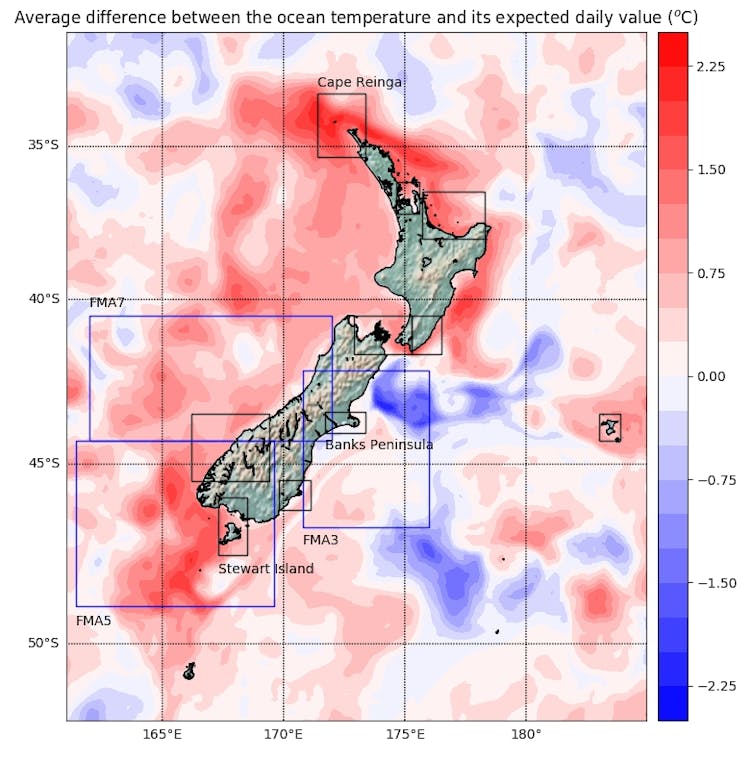
It revealed that most coastal areas around New Zealand were warmer than normal during this last winter (June to August 2021), as highlighted in the map showing the difference between winter 2021 average sea surface temperatures and the climatology (daily mean values based on data from 25 years).

Temperature anomaly in relation to 25 years of climate data. The boxes show the regions where detailed analysis and detection of marine heatwaves is carried out. Photo: Author provided
A warm winter for New Zealand’s waters
Marine heatwaves are defined as periods of five days or more of ocean temperatures in the top 10% of local average values for the time of year.
During winter 2021, surface waters were on average 0.3℃ (±0.75) warmer than usual, with peaks occasionally reaching +4.2℃. In contrast, in a few areas, such as the Pegasus and Kaikoura canyons to the north-east of Banks Peninsula, we observed cooler than normal temperatures.
Except for the Banks Peninsula and the FMA3 box to the east of the South Island, all other 11 areas experienced marine heatwaves during the winter.
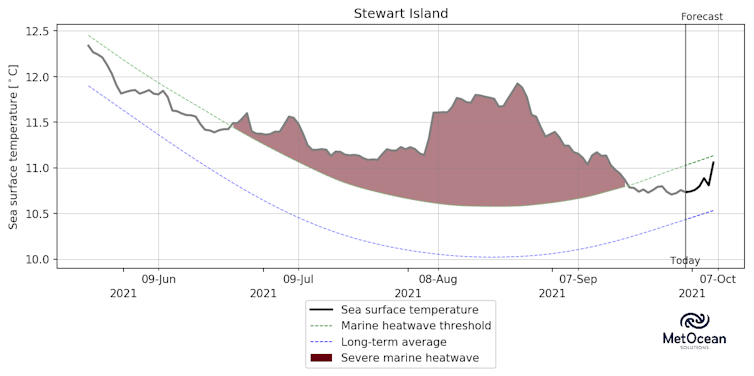
The events varied in intensity and duration. While Cape Reinga showed a continuous moderate event, Stewart Island experienced a severe winter marine heatwave that lasted 87 days, with maximum temperatures reaching 1.9℃ above long-term climate data.

Sea surface temperatures for Stewart Island. The blue line shows the daily mean temperatures and the green line the 10% highest temperatures, calculated from a period of 25 years. The shaded red area indicates a marine heatwave. Photo: Author provided
Both areas are particularly important since they are located at the northern and southern extremities, respectively, of the main currents that hug the eastern coastline of New Zealand. The warm waters in these regions move downstream (southward from Cape Reinga, and north-eastward from Stewart Island) and warm most of New Zealand’s eastern coast.
We can expect serious economic impacts from such warming. Recent events in western Canada highlight, opens in a new window the devastating impact summer marine heatwaves can have on coastal marine ecosystems and aquaculture.
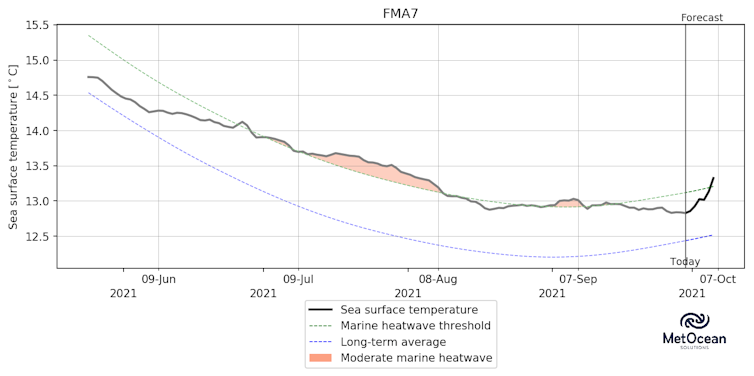
In New Zealand, Fisheries Management Area 7 (FMA7) in the map matches hoki spawning grounds and is, therefore, of critical importance to deep-water fisheries. The hoki fishery is worth about NZ$230 million in export revenue. In 2017, the fishery’s catch shortfall was about 8,500 tonnes, which constitutes a loss to the New Zealand economy of some NZ$13 million.

Sea surface temperatures for the fisheries management area where hoki spawn. The red areas show the occurrence of marine heatwaves this past winter. Photo: Author provided
While the reasons for this are not yet fully understood, the Deepwater Group, opens in a new window, which represent quota owners from New Zealand’s deep-water fisheries, suspects warmer-than-usual temperatures resulted in fewer hoki arriving at the winter spawning grounds off the west coast of the South Island.
A greater focus on winter marine heatwaves will help us understand how fisheries and aquaculture in New Zealand may be affected and what we can do to minimise economic, societal and biodiversity losses.
Read more: The future is now: how the ocean can help us solve the climate crisis
Changes across the southwest Pacific affect New Zealand
We know ocean temperatures are warming faster during winter than summer around New Zealand, opens in a new window and across the wider subtropical southwest Pacific Ocean, opens in a new window. The warming has become particularly evident since 2010 and has manifested in the emergence of the “Southern Blob”.
This ocean hotspot is centred northeast of New Zealand and has been linked to drought, opens in a new window in both South America, opens in a new window and New Zealand.
Read more: How a scientist made sure the oceans weren't forgotten
The current rate of warming in the Southern Blob exceeds natural variability, opens in a new window, implying a contribution from human-induced climate change. Along with changes in the regional atmosphere, this large-scale process increases the likelihood of winter marine heatwaves around New Zealand.
Our research, opens in a new window shows the deepest and longest-lasting marine heatwaves in the Tasman Sea are typically driven by ocean currents — in contrast to shallower summer marine heatwaves, which are driven by the atmosphere.
The warmer-than-normal winter ocean temperatures in the Tasman and coastal seas around New Zealand send warning signals about what the summer may bring. On top of impacts on coastal ecosystems, marine heatwaves also affect extreme weather and make floods and tropical storms over New Zealand more likely during the coming summer.

João Marcos Azevedo Correia de Souza, opens in a new window, MetOcean Solutions Science Manager of the Research and Development Team. Moana Project Science Lead, MetService — Te Ratonga Tirorangi, opens in a new window; Amandine Schaeffer, opens in a new window, , UNSW, opens in a new window; Jonathan Gardner, opens in a new window, , Te Herenga Waka — Victoria University of Wellington, and Robert Smith, opens in a new window,
This article is republished from The Conversation, opens in a new window under a Creative Commons license. Read the original article, opens in a new window.


